


Spatial Biology-Enabled Lab
Spatial relationships between cells and structures are critical to their development and pathophysiology. With the emergence of spatial transcriptomics technologies, we can now bridge histology and genomics to deepen our understanding of cellular organization and gene expression within a tissue of interest.
As histology experts, AcelaBio provides a complete seamless package of end-to-end wet lab to dry lab services meaning we can take care of everything from sample processing to data analysis enabling you to gain valuable, reproducible, high-quality insights. All we need are formalin fixed paraffin embedded (FFPE) tissue blocks or tissue sections (stained or unstained) on glass slides and we will take care of the rest.
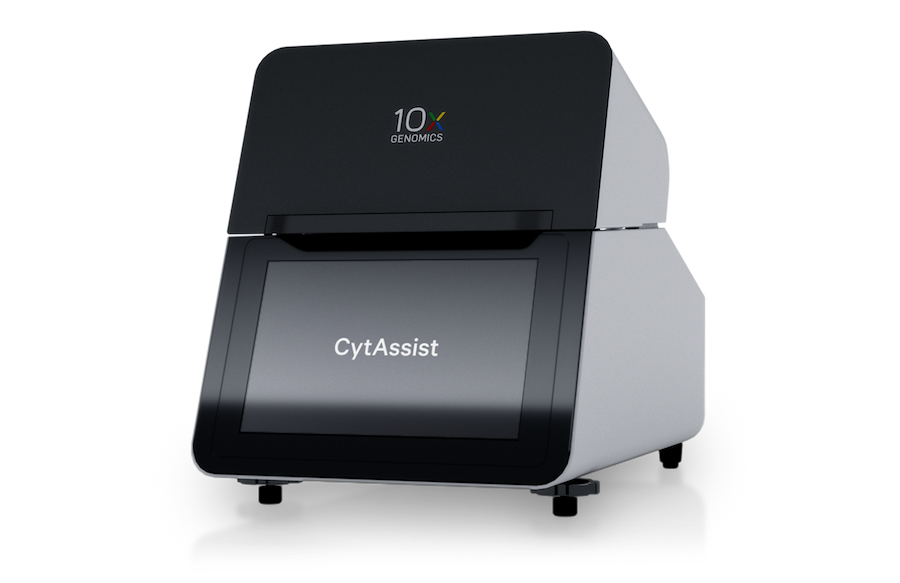
Visium HD CytAssist
Visium HD delivers high-definition spatial insights at single-cell resolution. Explore the whole transcriptome (human or mouse) within intact tissue sections to reveal cellular interactions, tissue organization and molecular insights.
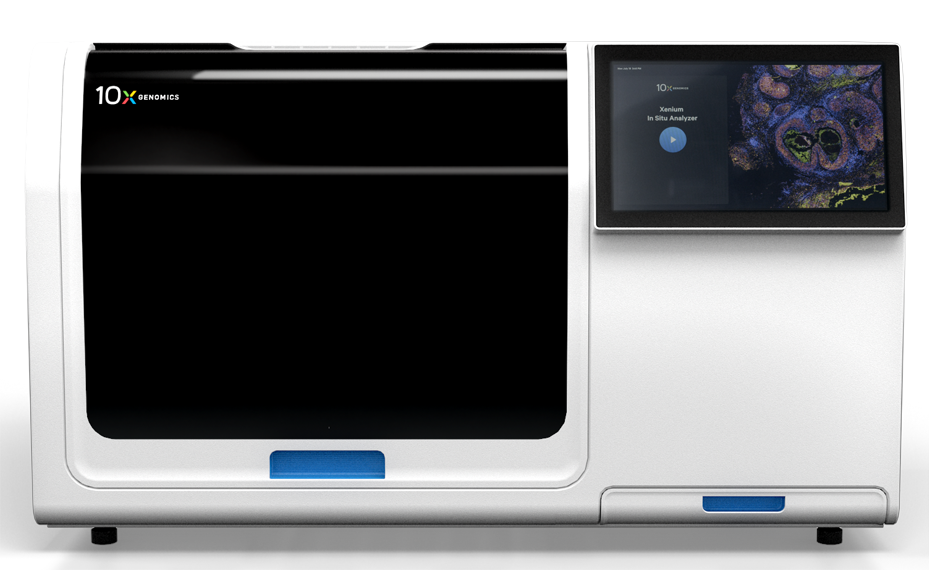
Xenium Analyzer
The Xenium platform provides high-plex in situ analysis at subcellular resolution with nanometer precision, delivering a complete solution—from comprehensive panel options to powerful imaging—to generate fast, reliable single-cell spatial insights.
Key Benefits of Spatial Transcriptomics at AcelaBio
At the forefront of science and innovation, AcelaBio offers complete end-to-end spatial transcriptomics workflows leveraging 10X Genomics Visium HD and Xenium Platforms. Our histology expertise coupled with our molecular capabilities delivers best in class biomarker insights.
We Make Spatial Transcriptomics Look Easy
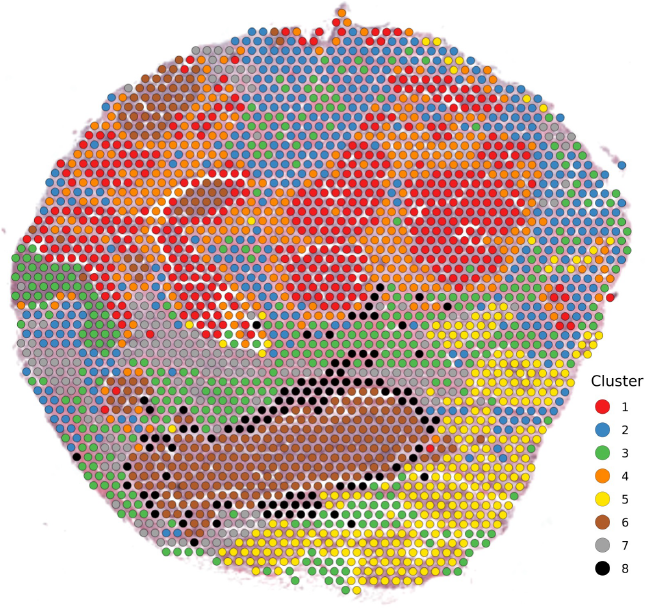
Define and visualize tissue architectures from spatially resolved transcriptomics with AcelaBio.
Our experienced scientific team provides seamless delivery from project initiation to delivery of data.
✓ One-Stop-Shop for All Your Needs
Save time and resources by accessing our end-to-end spatial transcriptomics service.
✓ High Quality
Our workflows are optimized and validated in line with clinical quality standards.
✓ Interactive Data Analysis
We work closely with you to achieve the level of analysis you require to derive meaningful discoveries.
✓ Long-Lasting Partnership
We provide solutions throughout the entire lifecycle of product development – from biomarker discovery to biomarker development.
✓ Validation
We can develop different orthogonal methods (e.g., single- or multiplex-immunohistochemistry) to validate targets discovered through the spatial transcriptomics workflow.
Deriving Novel Insights to Accelerate Your Research
Spatial transcriptomics generates ‘big’ data requiring programming and statistical expertise to maximize biomarker discovery
We are serious about data analysis
Our analysis and visualization packages go beyond the standard assessments and dive deep into the data to increase the value of your output. We offer a flexible, iterative approach based on your study objectives with the goal of helping you understand what your data means through integration with highly curated datasets.
Partner with a 10X Certified Service Provider
As one of the earliest adopters of 10X Genomics’ Visium CytAssist technology, we pride ourselves on being a trusted spatial transcriptomics partner to leading pharmaceutical and biotechnology companies. AcelaBio is a 10X Certified Provider and has been recognized by 10X Genomics for its expert ability to deliver high quality, reproducible spatial transcriptomics data in a timely manner.